Advanced Excel refers to a set of skills and techniques that go beyond basic spreadsheet functions, allowing users to manage, analyze, and visualize data more effectively. It includes complex formulas, data analysis tools, and automation techniques, which can significantly improve productivity, decision-making, and reporting efficiency.
Excel is widely used in fields like finance, data analysis, project management, business intelligence, and more. With advanced Excel skills, professionals can automate repetitive tasks, work with large datasets, and present data in a more insightful way.
| MODULE | TOPIC COVERED |
| Review of Excel Basics | Refresher on basic Excel functions: cell references, basic formulas, and formatting tools. |
| Advanced Functions | Detailed study of functions like VLOOKUP, HLOOKUP, INDEX, MATCH, SUMIFS, COUNTIFS, IFERROR, and others. |
| Text Functions | Working with text data: LEFT, RIGHT, MID, CONCATENATE, TEXTJOIN, FIND, SUBSTITUTE, and TEXT functions. |
| Date and Time Functions | Manipulating date and time data using TODAY, NOW, DATEDIF, DATEVALUE, NETWORKDAYS, and custom date formatting. |
| Array Formulas | Introduction to array formulas, using CTRL+SHIFT+ENTER to perform calculations over ranges. |
| PivotTables and PivotCharts | Creating and customizing PivotTables and PivotCharts for summarizing and analyzing large datasets. |
| Advanced Data Validation | Using data validation rules, creating dropdown lists, preventing data entry errors, and controlling user input. |
| Conditional Formatting | Applying conditional formatting rules, using formulas within formatting rules, and visualizing trends. |
| Data Analysis Tools | Using Power Query for data extraction and cleaning; Solver for optimization problems and goal seeking. |
| Power Pivot and Data Models | Using Power Pivot to create data models, relationships, and managing large datasets efficiently. |
| Charts and Graphs | Creating advanced charts (e.g., scatter plots, histograms, bubble charts), and interactive dashboards. |
| Excel Dashboards | Building dynamic dashboards with slicers, pivot tables, charts, and conditional formatting. |
| VBA and Macros | Introduction to Visual Basic for Applications (VBA), recording macros, and automating tasks. |
ELIGIBILITY - 10TH ABOVE

Course Code : S-ADVACNE EXCEL

Course Code : S-ROBOTICS AND CODING

Course Code : S-WORDPRESS

Course Code : S-REACT WITH DJANGO

Course Code : S-PYTHON PROGRAMMING

Course Code : S-JAVA PROGRAMMING

Course Code : S-C PROGRAMMING

Course Code : S-C++ PROGRAMMING

Course Code : S-DATABASE

Course Code : S-SCRATCH PROGRAMMING

Course Code : S-OPERATING SYSTEM

Course Code : S-NETWORKING
Course Code : S-OFFICE TOOLS

Course Code : S-GRAPHICS DESIGNING
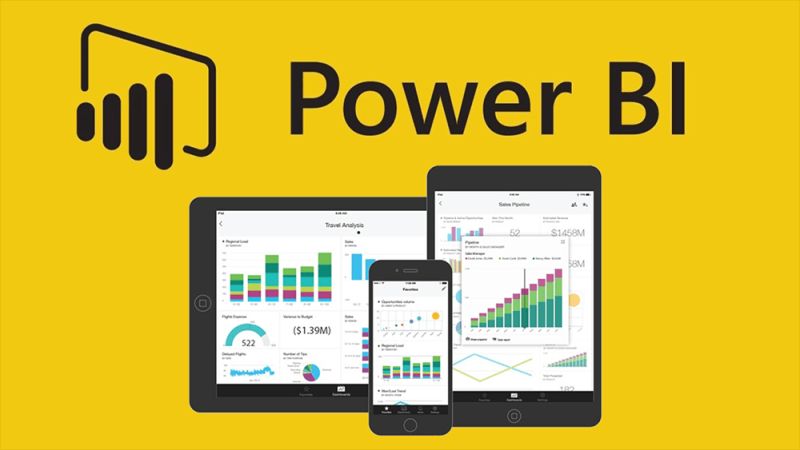
Course Code : S-POWER BI
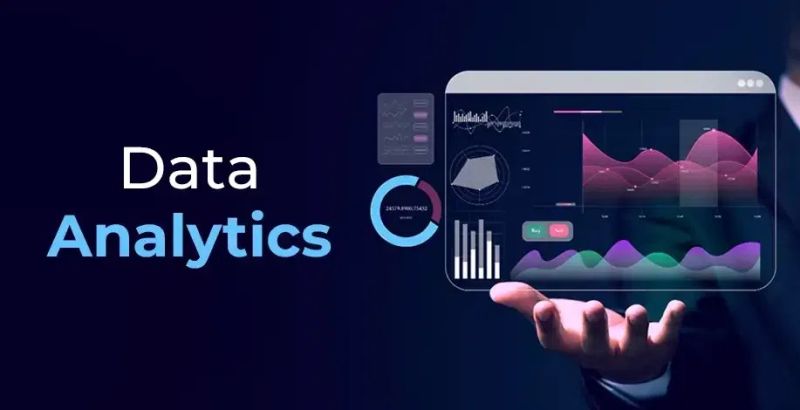
Course Code : S-DATA ANALYTICS

Course Code : S-12CBSE

Course Code : S-11CBSE

Course Code : S-RS-CIT

Course Code : S-CYBER SECURITY

Course Code : S-DSA WITH C

Course Code : S-LINUX & SHELL PROGRAMMING WITH KALI

Course Code : S-DATA SCIENCE

Course Code : S-ML WITH PYTHON

Course Code : S-JAVASCRIPT
